IoT Raspberry Pi ZeroW monitoring with Zabbix and Grafana
 The Raspberry PI range of IoT devices are very different from the Electric Imp IoT devices I have previously used. The Pi is a full function computer in a very small form factor, particularly the Zero W (with built-in WiFi and Bluetooth). Unlike the Electric Imp. the Pi gives you full access to the Operating System, allowing you to install additional software (although, to be fare, you don't need to add much to what already comes with it). In my case, this only involved adding a Zabbix Agent. Full access to the Operating System does, of course, place a responsibility on you to manage your own security but it does allow much greater flexibility (with the exception of any Analogue to Digital Converters ADC, that is).

Being able to install a Zabbix Agent on the Pi adds a couple more possibilities over the Electric Imp setup. Firstly, the Zabbix Agent can be configured in "Active" mode which will push collected data to the Zabbix Server rather than the Zabbix Server polling the IoT device. Secondly, it allows for the usage of a local Zabbix Proxy, this can accept the Zabbix Agent data even if the connection to the Zabbix Server is down, sending data later when the Zabbix Server connection is re-established. In the above example, the Zabbix Proxy is deployed of a pfSense Server which is also acting as a WiFi AP for the Pi.
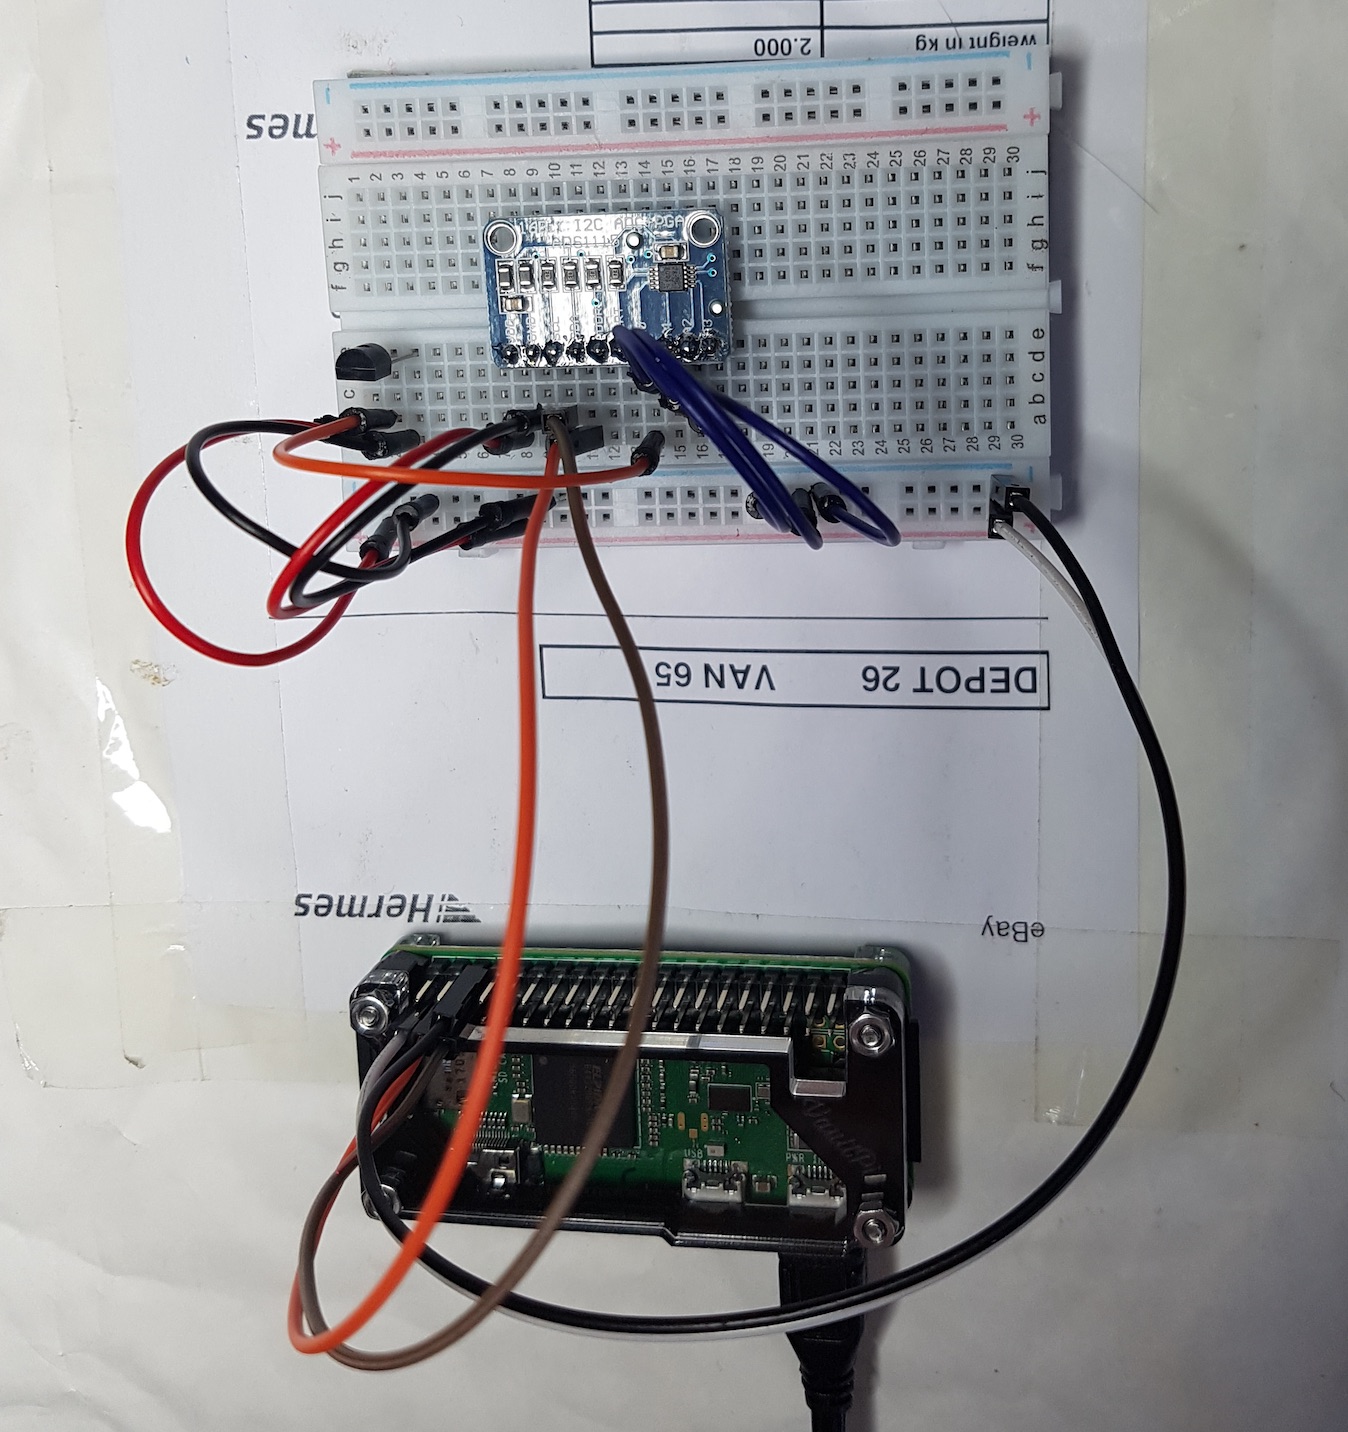
In the above picture the hardware has been put together using a "Breadboard" with fly leads but this could easily be constructed in a case with battery power. As the Pi has no ADC, an external ADC is required, the small blue board at the top (and ADS1115 From Texas Instruments). This is directly connected to the thermal Sensor via one of it's four analogue channels. It is connected to the Pi via one of the Pi's I2C busses.
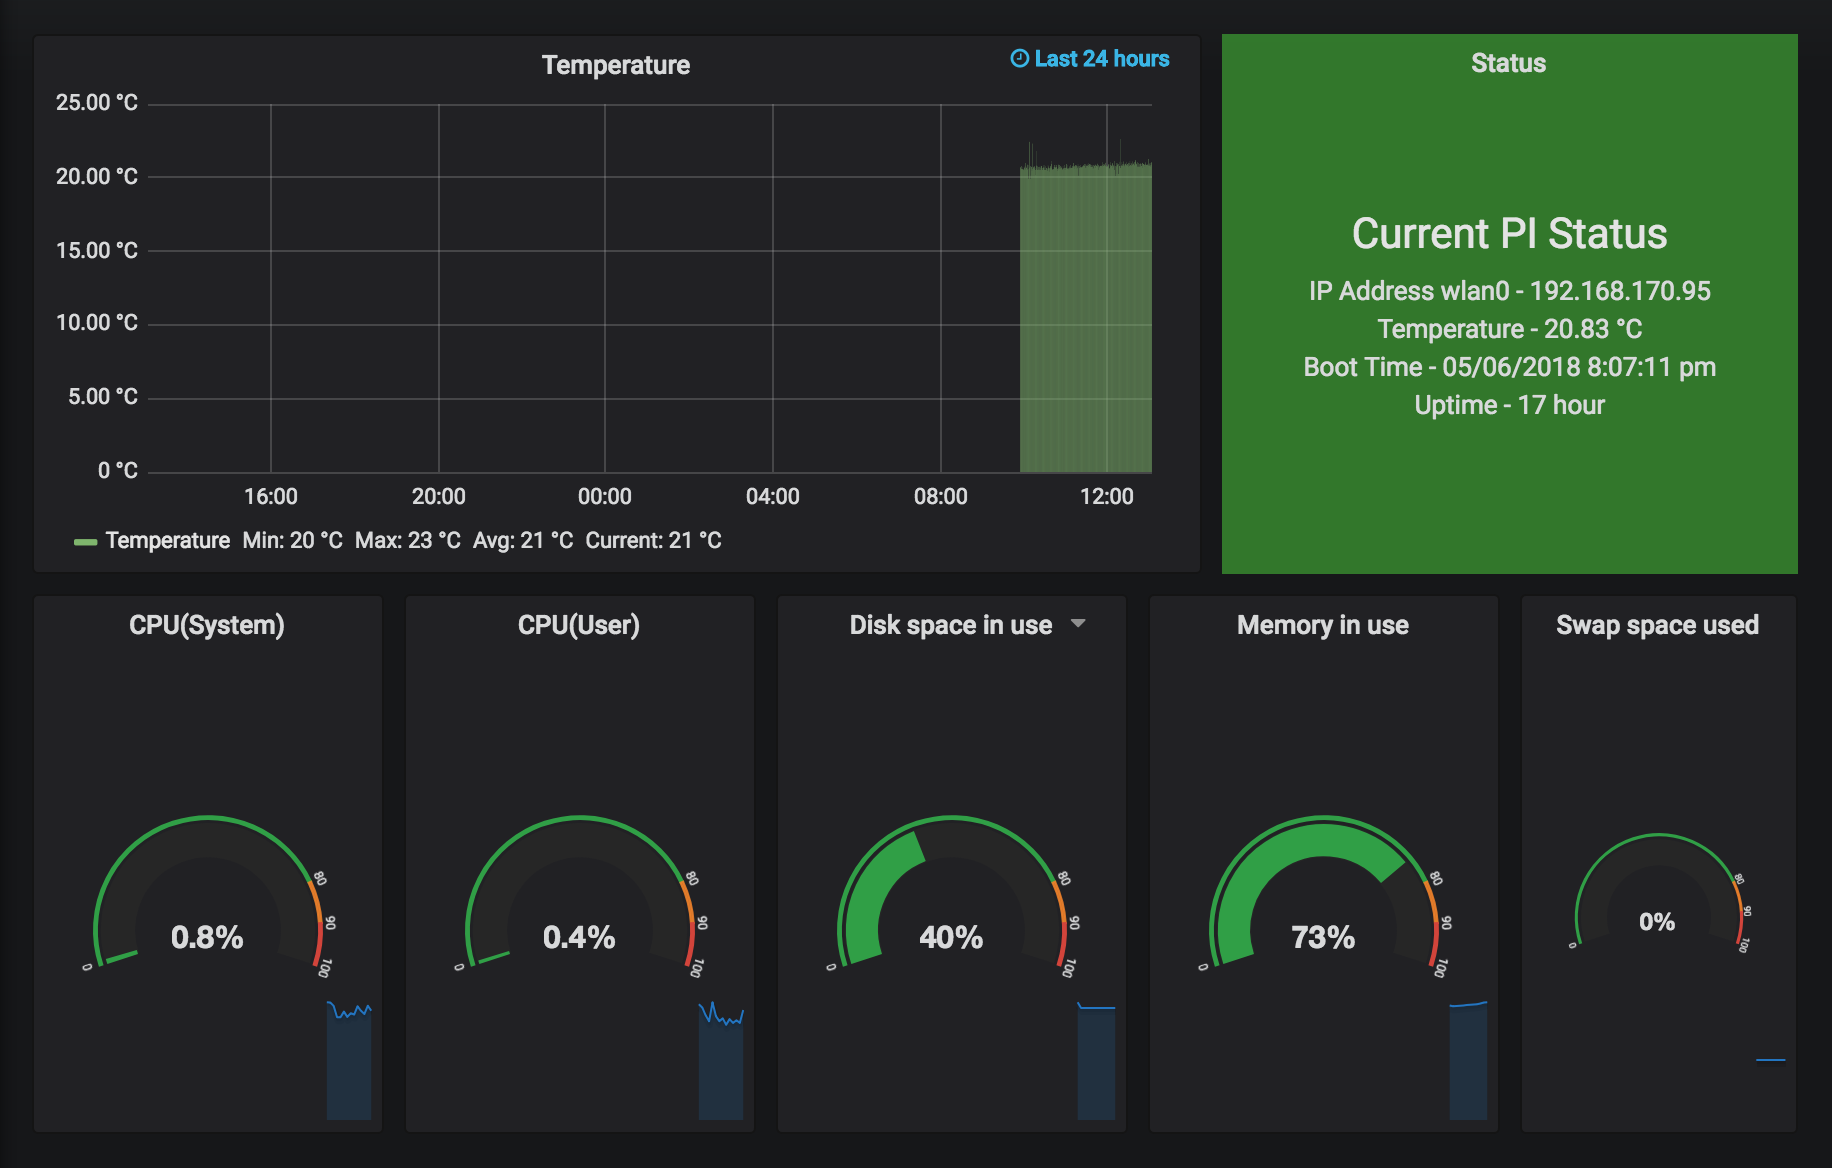
And lastly, the data is passed to a Zabbix Server and presented vi a Grafana Dashboard as below.
Experimentation with Juju Part 1

Juju is described as "An open source application modelling tool. Deploy, configure, scale and operate your software on public and private clouds". I was particularly interested in the "Deploy" capability and that it works over a number of different Cloud Hosting providers. My understanding of Juju so far is that it allows you to define groups of applications to be deployed to dynamically expandable (or contractable) groups of Cloud Hosted Servers within containers. It's own controlling application (the "Controller") is also deployed in the same manner.
My first attempt to start playing was to try and getting Juju running on my MacBook because it looked like that was possible. You can install Juju itself (brew install juju) and you can connect to a remote Juju Controller (juju register) but trying to use the localhost as a Juju Controller proved difficult. Trying to create a localhost (juju bootstrap localhost) resulted in an error saying that lxd (the container system) was not installed, which it wasn't. Trying to get lxd installed on OSX turned into a bit of a deep Rabbit Hole experience. So I tried bootstraping (juju bootstrap aws) an Amazon EC2 instance as the controller. This was remarkably simple after setting setting up API Authentication on the Amazon EC2 console and then adding the credentials to Juju on OSX (juju add-credential aws).
Not wanting to keep an Amazon EC2 instance running while I experimented, I decided to create a VMWare Virtual Machine on OSX to run Ubuntu 16.04 to host the Juju Controller.
Install from ISO of Ubuntu Server 16.04
logon
sudo -i
apt update
apt upgrade
apt install openssh-server
apt install lxd
apt install juju
dpkg-reconfigure -p medium lxd
(take all the defaults but No for IPv6 subnet)
juju bootstrap
(lxd on localhost)
juju gui
(gives the internal lxd container IP, port, URL, login username and password user the IP and port in the following)
iptables -t nat -A PREROUTING -p tcp -i ens33 --dport 17070 -j DNAT --to-destination 10.112.34.247:17070
(Needed to port forward to the lxd container, ens33 is the interface name from ifconfig)
browse to https://ip_of_vm:port/url-path
End of Part 1
IoT Electric Imp monitoring with Zabbix and Grafana
 The Electric Imp range of IoT devices offer a simple means to interface with a number of different physical data collection devices and connect back to a central controlling Server Platform via built-in WiFi. Code can be written and deployed from the central Server Platform that controls how the collected data is made available. In the following example I have used the built-in light level sensor data and exposed it via a simple web interface on the Server Platform. This data is collected and stored by a Zabbix Server and presented via a Grafana Dashboard.

The Electric Imp itself is packaged in an SD Card like enclosure which can be plugged into a number of different SD Card type sockets to give connectivity to power and physical interfaces. The Electric Imp has a light level sensor inside the SD Card type package that is used to read configuration instructions from a Smart Phone App (BlinkUp) to setup the WiFi parameters and can be used as a Light Sensor at run-time. Once configured and connected to a WiFi Network with Internet connectivity, the Electric Imp connects to the central Imp Cloud from which it will download any updates and Device code created for the device. The Imp Cloud will also have Agent code that runs on the Imp Cloud and controls communication between the Imp Cloud and the device.
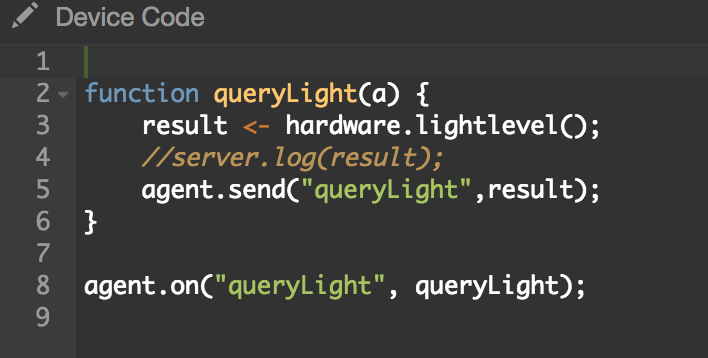
The Imp Device code used simply registers a function to be called when and Agent message of type "queryLight" arrives. When the function is called by the arrival of the message it reads the hardware lightlevel and sends that back to the Agent.
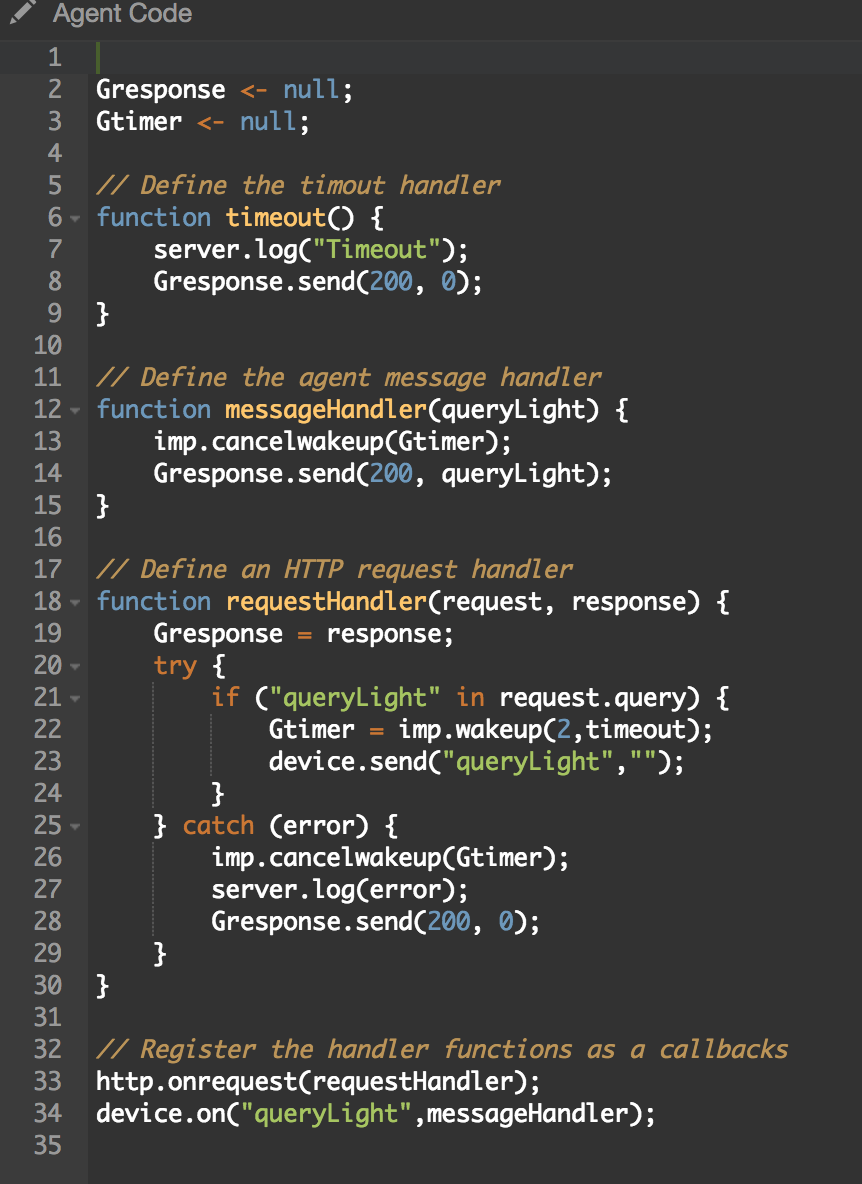
The Imp Agent code used is a little more complicated but all it does is to get triggered when a http get request arrives (the URL to use for the specific device is shown in the Development environment on Imp Cloud), sends a message to the device and passes the reply back as the http response. There is also code to handle timeouts communicating with the device. If there is any error communicating, a zero value is returned on the http response.
At the Zabbix Server, the local Zabbix Agent is used to send the https request to the Imp Cloud on the specific URL for the device and extract the Light Level data by using a "web.page.regexp" item (xxxxxxxxxxx replaced with the specific value from the Development Environment);
web.page.regexp[agent.electricimp.com,xxxxxxxxxx/?queryLight,80,"([0-9]+)$"]
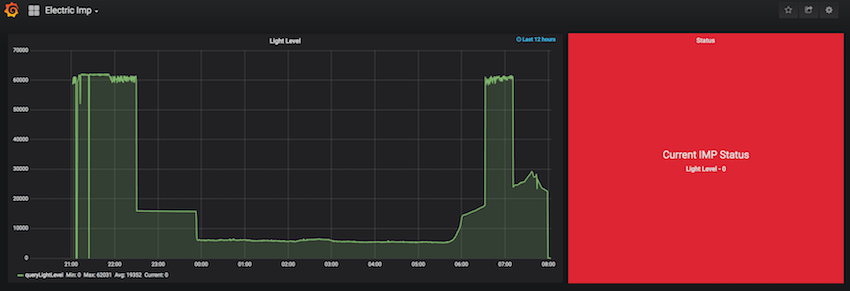
The data is then held on the Zabbix Server and used by a Grafana Dashboard to show a graph of the level and a status panel which shows red if there is a problem communicating with the device.
Part two here.
