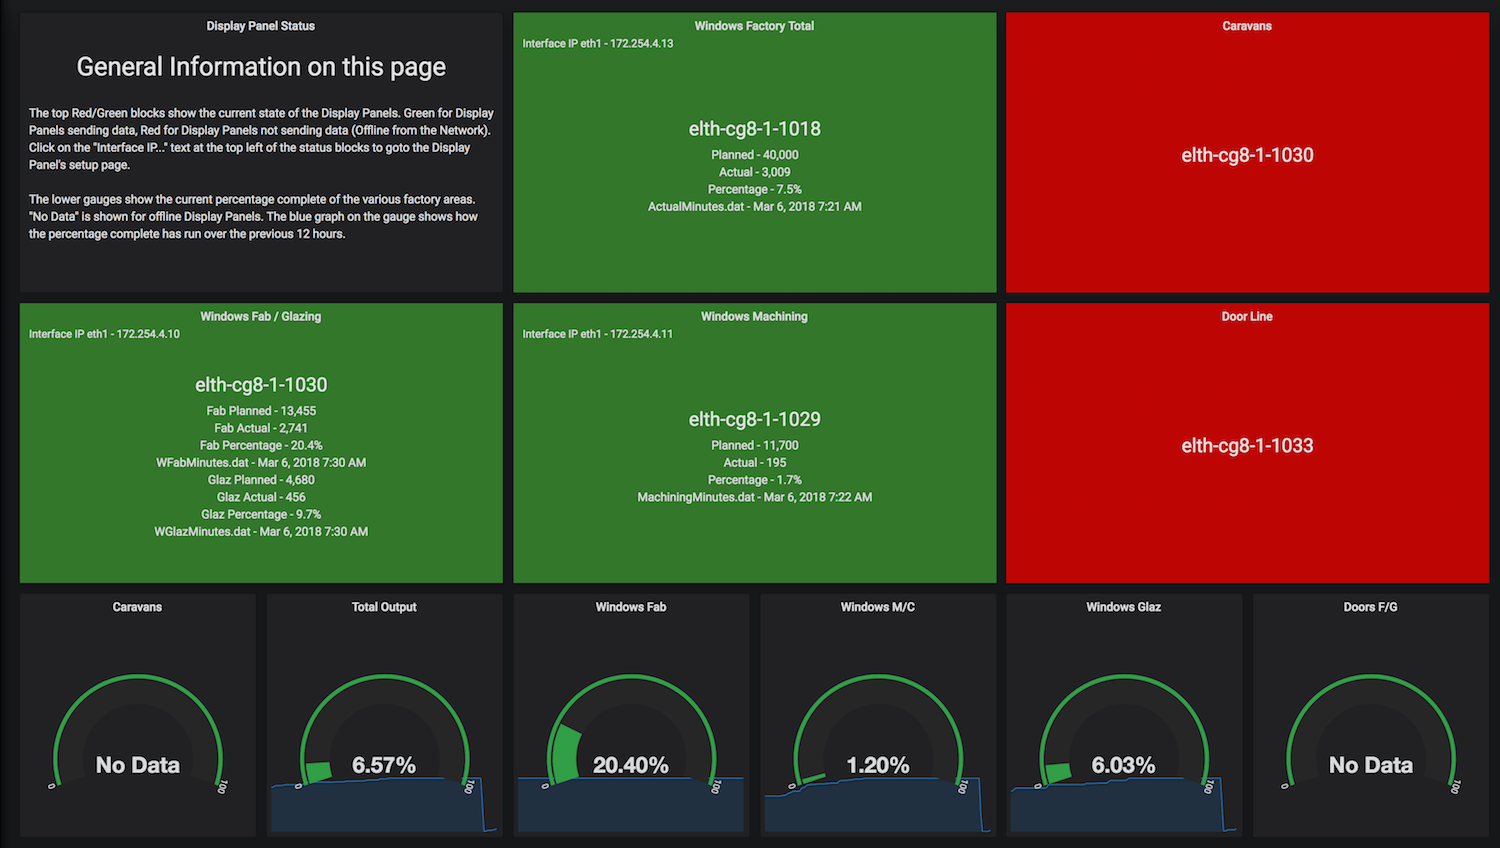
Grafana Dashboard using Zabbix data
We have enhanced the monitoring we are using to show the current state of a local manufacturing production line by using a Grafana Dashboard. A number of displays are situated around the production line facility which show the current plan and actual production at the current moment. Data is fed to the screens in real time and Zabbix is used to monitor the display's network status and to capture the current displayed data, this is then displayed in a single Grafana Dashboard.

Extending the reach of Grafana Data Sources
 Here’s a short overview of a recent project for a client of ours that run some very large WiFi networks and need to let their clients have access to a simple status and performance Dashboard.
The sensible decision had already been made to use Grafana as the front-end Dashboard display Server. Grafana is built to allow for the construction of Dashboards using a wide range of visual styles and obtaining data from a range of Data Sources. However, the range of Data Sources was not quite wide enough for this project. Much of the data being held in MySQL databases (from Grafana 4.3+, a MySQL Data Source is provided) originating from a customised SugarCRM and a freeRADIUS Server. Also, much of this data needed to be reformatted and summarised before ending up on a Dashboard. Data was also to be used from a Zabbix Network Monitoring Server and a Graylog logging Server holding data for Graylog.
Data that was either not directly supported by Grafana or needed further processing through some intermedia system was handled by Pentaho which was used for summarising and converting the data and passing it to InfluxDB databases so that it could be directly used by Grafana. Some of the data from Graylog could be read directly from the underlying ElasticSearch Indexes and all the data from Zabbix could be accessed by Grafana via the Zabbix Grafana plugin by Alexander Zobnin.

    |
    |


