SugarCRM Community Edition is dead
 --->>>
It was all done a bit on the quiet but Clint Oram, CMO & Co-Founder of SugarCRM Inc. posted on the company blog that "Sugar Community Edition open source project ends" back in April this year, ending the company's previous commitment to SugarCRM CE as an Open Source Project. Luckily all is not lost as Suite CRM can be used as a direct upgrade from the last SugarCRM CE release (see here and here).
I used the upgrade process to help migrate an old SugarCRM CE 6.5.11 running on an old CentOS 5.8 Virtual Private Server at Rackspace to a new Amazon Lightsail instance running Ubuntu 16.04. Oh and with PHP 7.
Using Zabbix as a Platform for Application and Business Process Monitoring
 A real world implementation of Zabbix Monitoring to help manage a Production Line in a Manufacturing Business.
 A while ago, well to be honest two and a half years ago, I built and installed a Factory Floor Information Display System at a client's site (Custom Built Appliance Based Information Display System from CommuniG8 installed at Eltherington Industries). The system is feed with data from two sources. The first is the planned man hours for work to be completed during a shift and is set at the start of the shift. The second is fed acutomatically as completed items come off the Production Line. This information is displayed on a large display screen together with a percentage to show how near completing the shift's planned work they are at any time.
 Earlier this year, four more displays where added being fed with data that related to different parts of the Production Line. Zabbix (1.8.3 I know I should be using v2 by now) was also introduced, originally just to monitor the technical metrics on the displays and to check availability. The Zabbix Agents were configured to push data to the Zabbix Server as there was inbound connections were not allowed.
There were then five displays showing data from seven different points on the Production Line. Gathering this data into one central database could offer the opportunity to analyse the flows along the Productions Line. As Zabbix was there collecting system performance and availability data, there was the option to extend this data collection to include metrics from the application itself. A small application change was introduced to save the current values for planned, actual and completed percentage to files. The Zabbix agent was then configured via "User Parameters" to read these files and pass the values back to the Central Zabbix Server. This information could then all be displayed on a Zabbix Map.
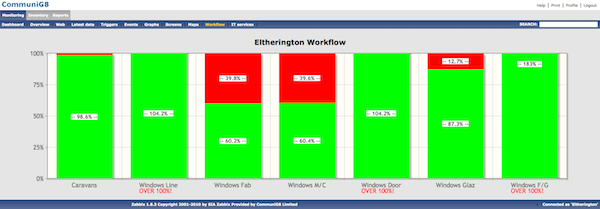
This allowed all the information to be seen in one place and show some checks for anything that might be out of kilter (more than 100% completed for example). Using this map together with the graphing facilities of Zabbix allowed analysis of how completion percentages varied thoughout the Production Shift. However, there was no simple way to show if the completion percentages were in balance along the whole Production Line. If all points on the Production Line are not completing at the same rate then this introduces unwanted delays at some part of the Production Line leading to inefficiantcies. So we needed a display of vertical bars for percentage complete at each point on the Production Line allowing us to easilly see which ones were out of step. Unfortunatly, none of the standard Zabbix Graphs could be setup to do this.
The data was easily avaiable in the "items" table "lastvalue" column. I created a new Zabbix page "workflow.php" (I had to update the "$ZBX_MENU" array in "include/menu.inc.php" so that the new page could be navigated to). The page had to include "include/page_header.php" and "include/page_footer.php" to gie it the Zabbix look and feel. This was all a bit of a hack, so to try to keep things secure a check was added in the new page that the logged on user was either "Admin" or the logon used by my client (by checking "$USER_DETAILS['alias']). A simple database query was used to get the lastvalue for each of the itemids required to get the seven completion percentages. I then used jQuery and jqPlot JavaScript libraries to draw the bar chart.
This is just one example of how the capabilities of Zabbix can be used as a platform for collecting Application metrics to help analyse a Business Process. It just needs Applications to be developed with instrumentation in mind and a willingness to extend the graphing funtionality of Zabbix. A cleaner approach to this would be to use the Zabbix API to access the data and use an external web site to render the results.
Thanks for reading, Richard Gate.
Any questions? Please e-mail me This email address is being protected from spambots. You need JavaScript enabled to view it.
Building RealOpInsight 2.4.0b2 on Mountain Lion (OSX 10.8)
 RealOpInsight is an Advanced Open Source Business Service Management Dashboard Toolkit. In this article I'll show you how to install this on OSX 10.8 Mountain Lion.


