Using InfluxDB and Grafana to monitor TFL Underground Rail Stations
 Transport for London (TFL) publishes a lot of Open Data for Public consumption about the status of the London Underground, in real time. This data is updated every 30 seconds in XML format and is mostly documented.
As a proof of concept I wanted to setup InfluxDB to hold the status of the Underground Stations and present the results on a Grafana Dashboard.
The first step was getting hold of the XML data. Unfortunately the SDK does not say what the Domain is to get the XML from. A little Googling allowed me to find the XML I needed here.
The next step was to extract the data needed from the XML. I wanted to get the name of the TFL Underground Station, It's status and a description of any issues. A simple PHP script was used to get this data, format it and use an Influx file import to add the data to an Influx Database. The PHP script is runs under cron every 60 seconds.
Finally I created a simple Grafana Dashboard using "Table Panel" panels to show the data.

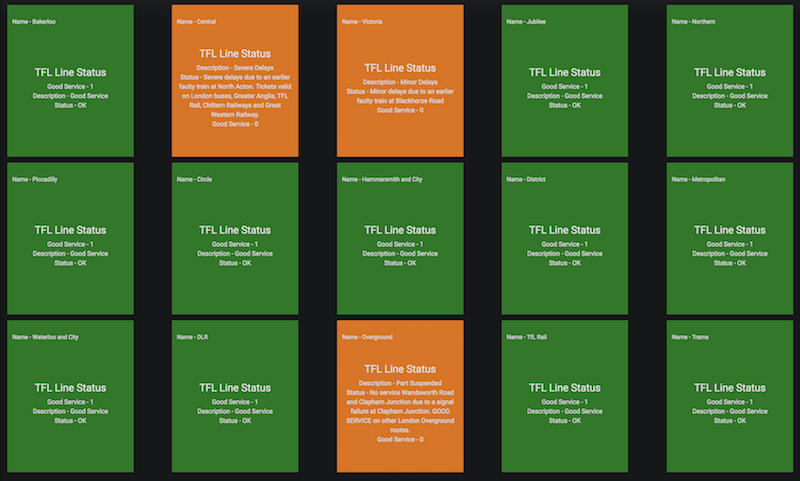
Using Zabbix and Grafana to monitor TFL Underground Rail Lines
 Transport for London (TFL) publishes a lot of Open Data for Public consumption about the status of the London Underground, in real time. This data is updated every 30 seconds in XML format and is mostly documented.
As a proof of concept I wanted to setup Zabbix to monitor the status of the Underground Lines and present the results on a Grafana Dashboard.
The first step was getting hold of the XML data. Unfortunately the SDK does not say what the Domain is to get the XML from. A little Googling allowed me to find the XML I needed here.
The next step was to extract the data needed from the XML. I wanted to get the name of the TFL Underground Line, It's status and a description of any issues. A simple PHP script was used to get this data, format it and use the Zabbix Sender (zabbix_sender) to post it into a Zabbix Server. I organised the Zabbix data using a Zabbix host for each one of the Lines with a few Zabbix items (which must be created as "Zabbix trapper" item type) to hold the data. The PHP script is run on a Zabbix Server (just for convenience really) under cron every 60 seconds.
Finally I created a simple Grafana Dashboard using "Status Panel" panels to show the data.

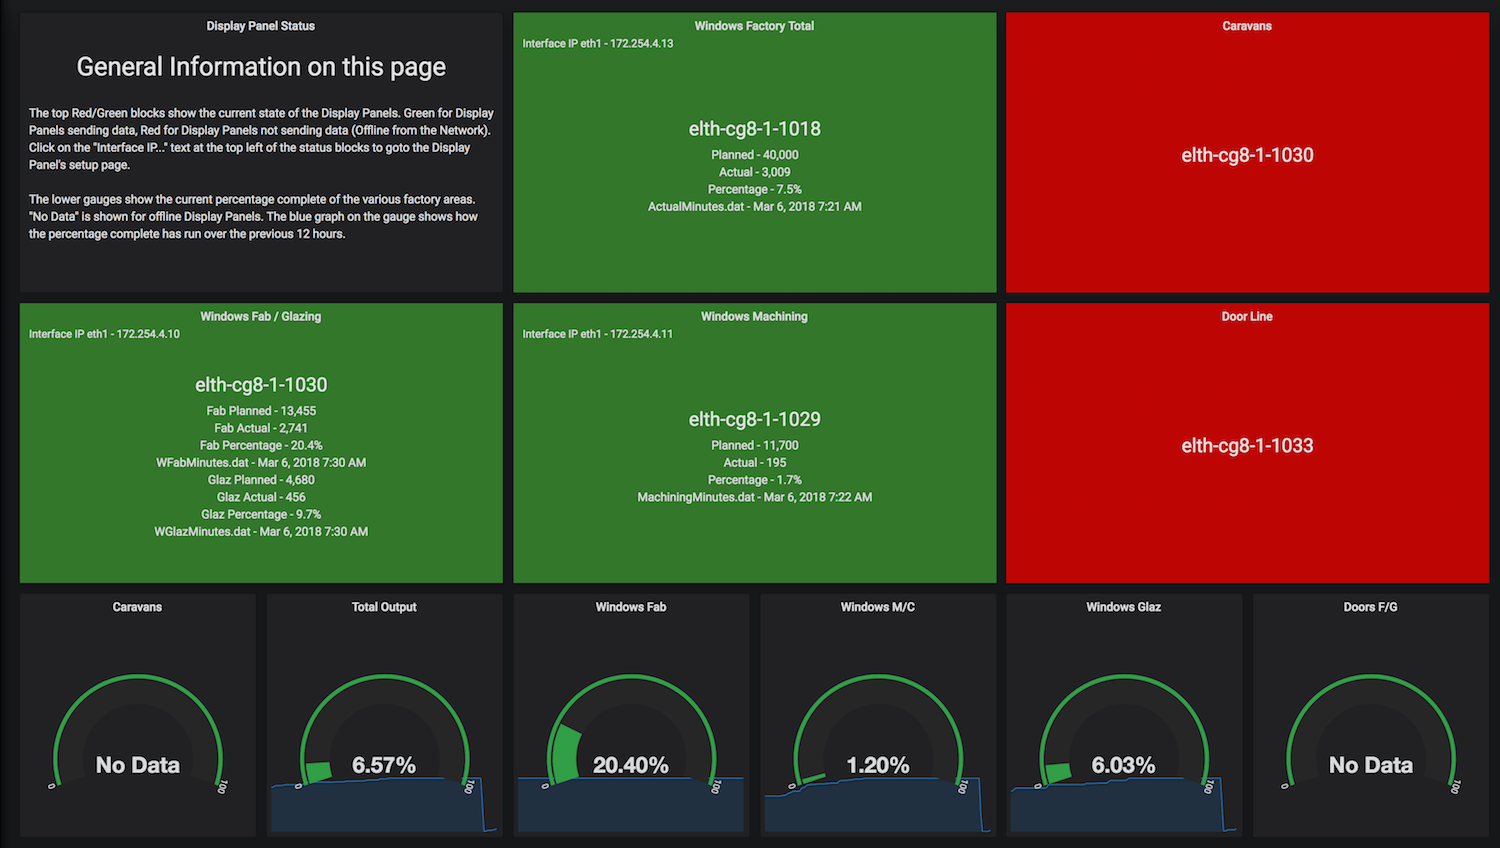
Grafana Dashboard using Zabbix data
We have enhanced the monitoring we are using to show the current state of a local manufacturing production line by using a Grafana Dashboard. A number of displays are situated around the production line facility which show the current plan and actual production at the current moment. Data is fed to the screens in real time and Zabbix is used to monitor the display's network status and to capture the current displayed data, this is then displayed in a single Grafana Dashboard.

