Monitoring Tanaza WiFi with Zabbix and Node Red
|
|
|
Tanaza is one of a number of Managed WiFi Systems available today. If you exclude the TP-Link and Ubiquiti type approaches to WiFi Management, which are tightly bound to their own hardware, almost without exception the cross platform WiFi Management Systems are based on customised builds of OpenWRT. This provides a WiFi Management System that allows a wide range of hardware from a wide range of manufacturers to be managed by the same system. This is a good thing. The only bad thing is that you cannot directly monitor what's going on inside the Managed Access Points via a Zabbix Agent as you can normally with OpenWRT.
|
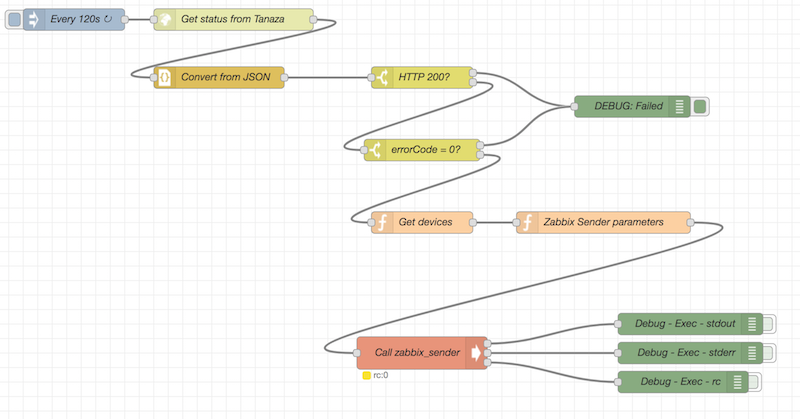
The approach taken to getting Tanaza Managed WiFi APs into the same Zabbix monitoring environment as other network devices was to make use of the Tanaza API. This allows access to a snapshot of the current status of your Tanaza Managed Networks. The Tanaza API Status query end point returns JSON encoded data with the status of every Managed WiFi AP connected to your Tanaza account. This is used by a timer driven Node Red flow that queries Tanaza every 120 seconds and converts the JSON data into a JavaScript object representation, as this is more convenient to work with. The flow then does a sense check that the Tanaza query worked ok, HTTP status 200 set and the Tanaza's errorCode is zero. A Node Red Function is then used to step through the Tanaza data extracting the status information for each AP in turn. Then another Node Red Function is used to take certain data from the AP status and build zabbix_sender parameters for each host item that is to be sent to Zabbix. Finally the zabbix_sender is invoked to send the data to the Zabbix Server. The data being monitored for each AP is its online/offline status, the number of connected WiFi clients (totaled across all SSIDs on the AP) and the name of the Tanaza Network the AP is used in.


