IoT Raspberry Pi ZeroW monitoring with Zabbix and Grafana
 The Raspberry PI range of IoT devices are very different from the Electric Imp IoT devices I have previously used. The Pi is a full function computer in a very small form factor, particularly the Zero W (with built-in WiFi and Bluetooth). Unlike the Electric Imp. the Pi gives you full access to the Operating System, allowing you to install additional software (although, to be fare, you don't need to add much to what already comes with it). In my case, this only involved adding a Zabbix Agent. Full access to the Operating System does, of course, place a responsibility on you to manage your own security but it does allow much greater flexibility (with the exception of any Analogue to Digital Converters ADC, that is).

Being able to install a Zabbix Agent on the Pi adds a couple more possibilities over the Electric Imp setup. Firstly, the Zabbix Agent can be configured in "Active" mode which will push collected data to the Zabbix Server rather than the Zabbix Server polling the IoT device. Secondly, it allows for the usage of a local Zabbix Proxy, this can accept the Zabbix Agent data even if the connection to the Zabbix Server is down, sending data later when the Zabbix Server connection is re-established. In the above example, the Zabbix Proxy is deployed of a pfSense Server which is also acting as a WiFi AP for the Pi.

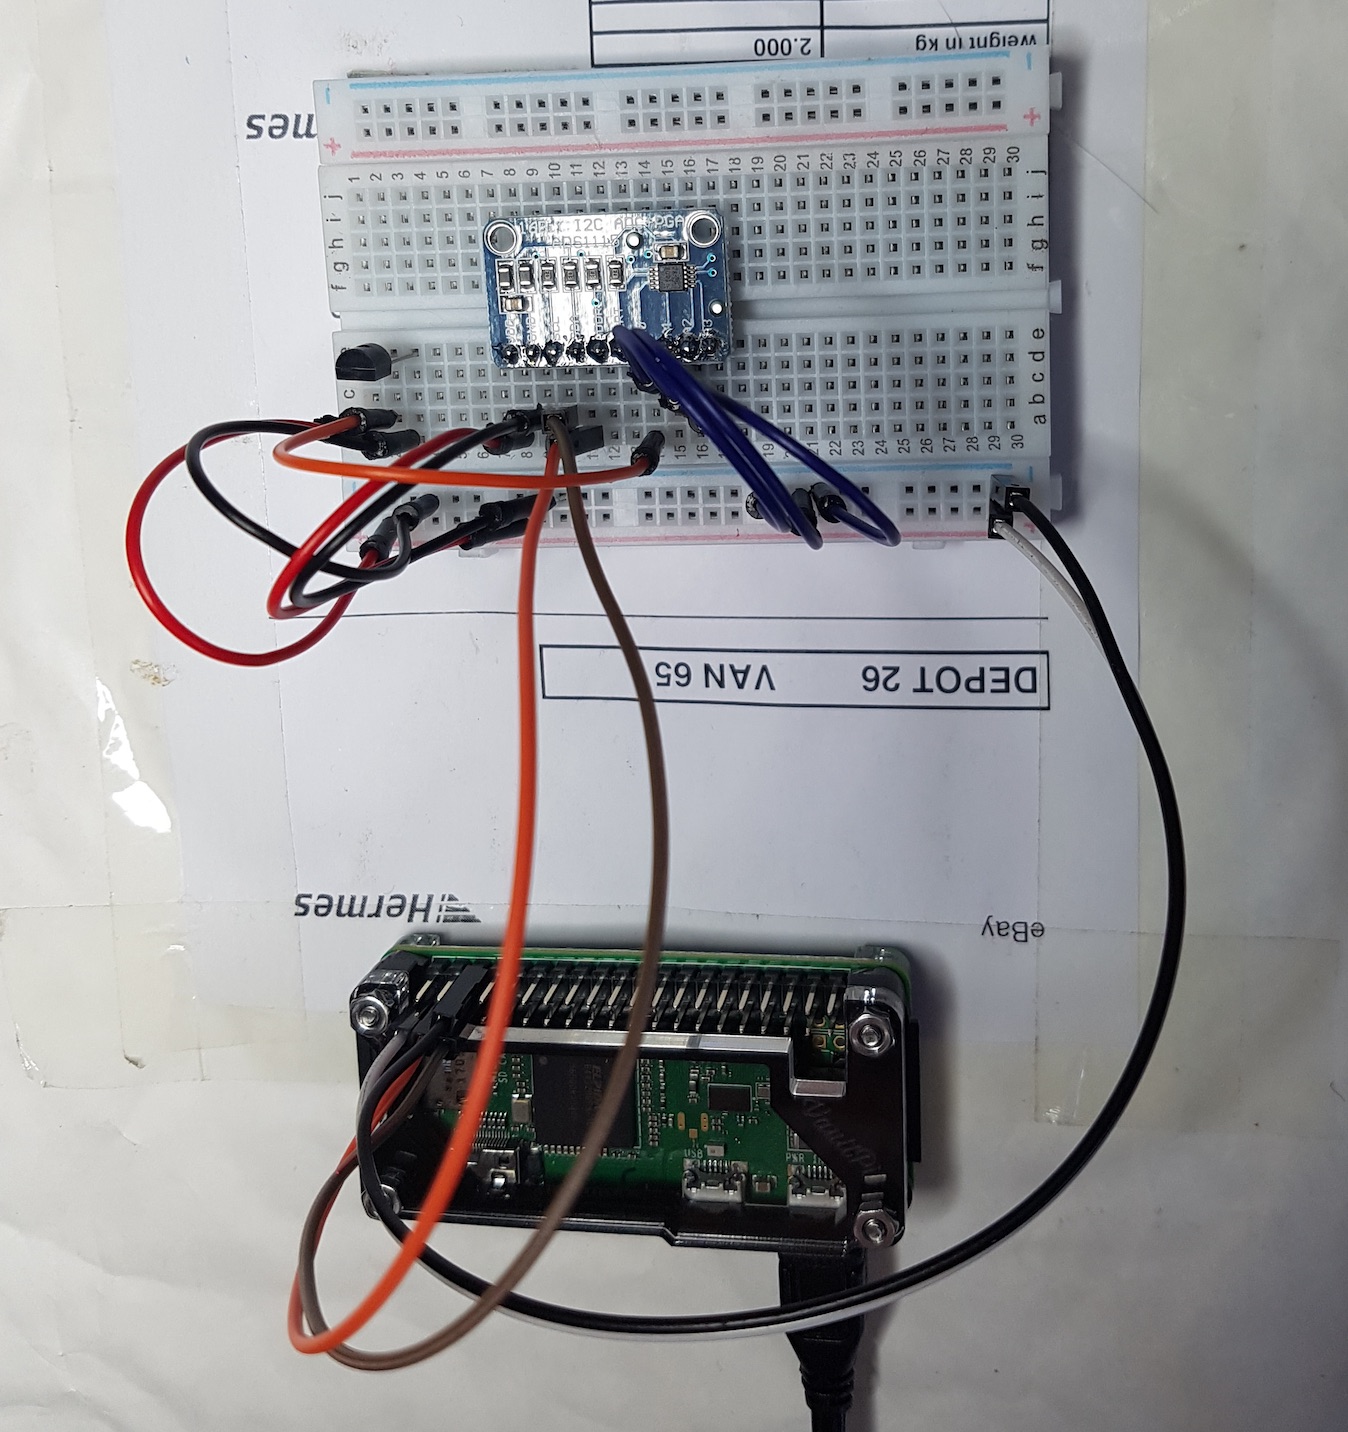
In the above picture the hardware has been put together using a "Breadboard" with fly leads but this could easily be constructed in a case with battery power. As the Pi has no ADC, an external ADC is required, the small blue board at the top (and ADS1115 From Texas Instruments). This is directly connected to the thermal Sensor via one of it's four analogue channels. It is connected to the Pi via one of the Pi's I2C busses.
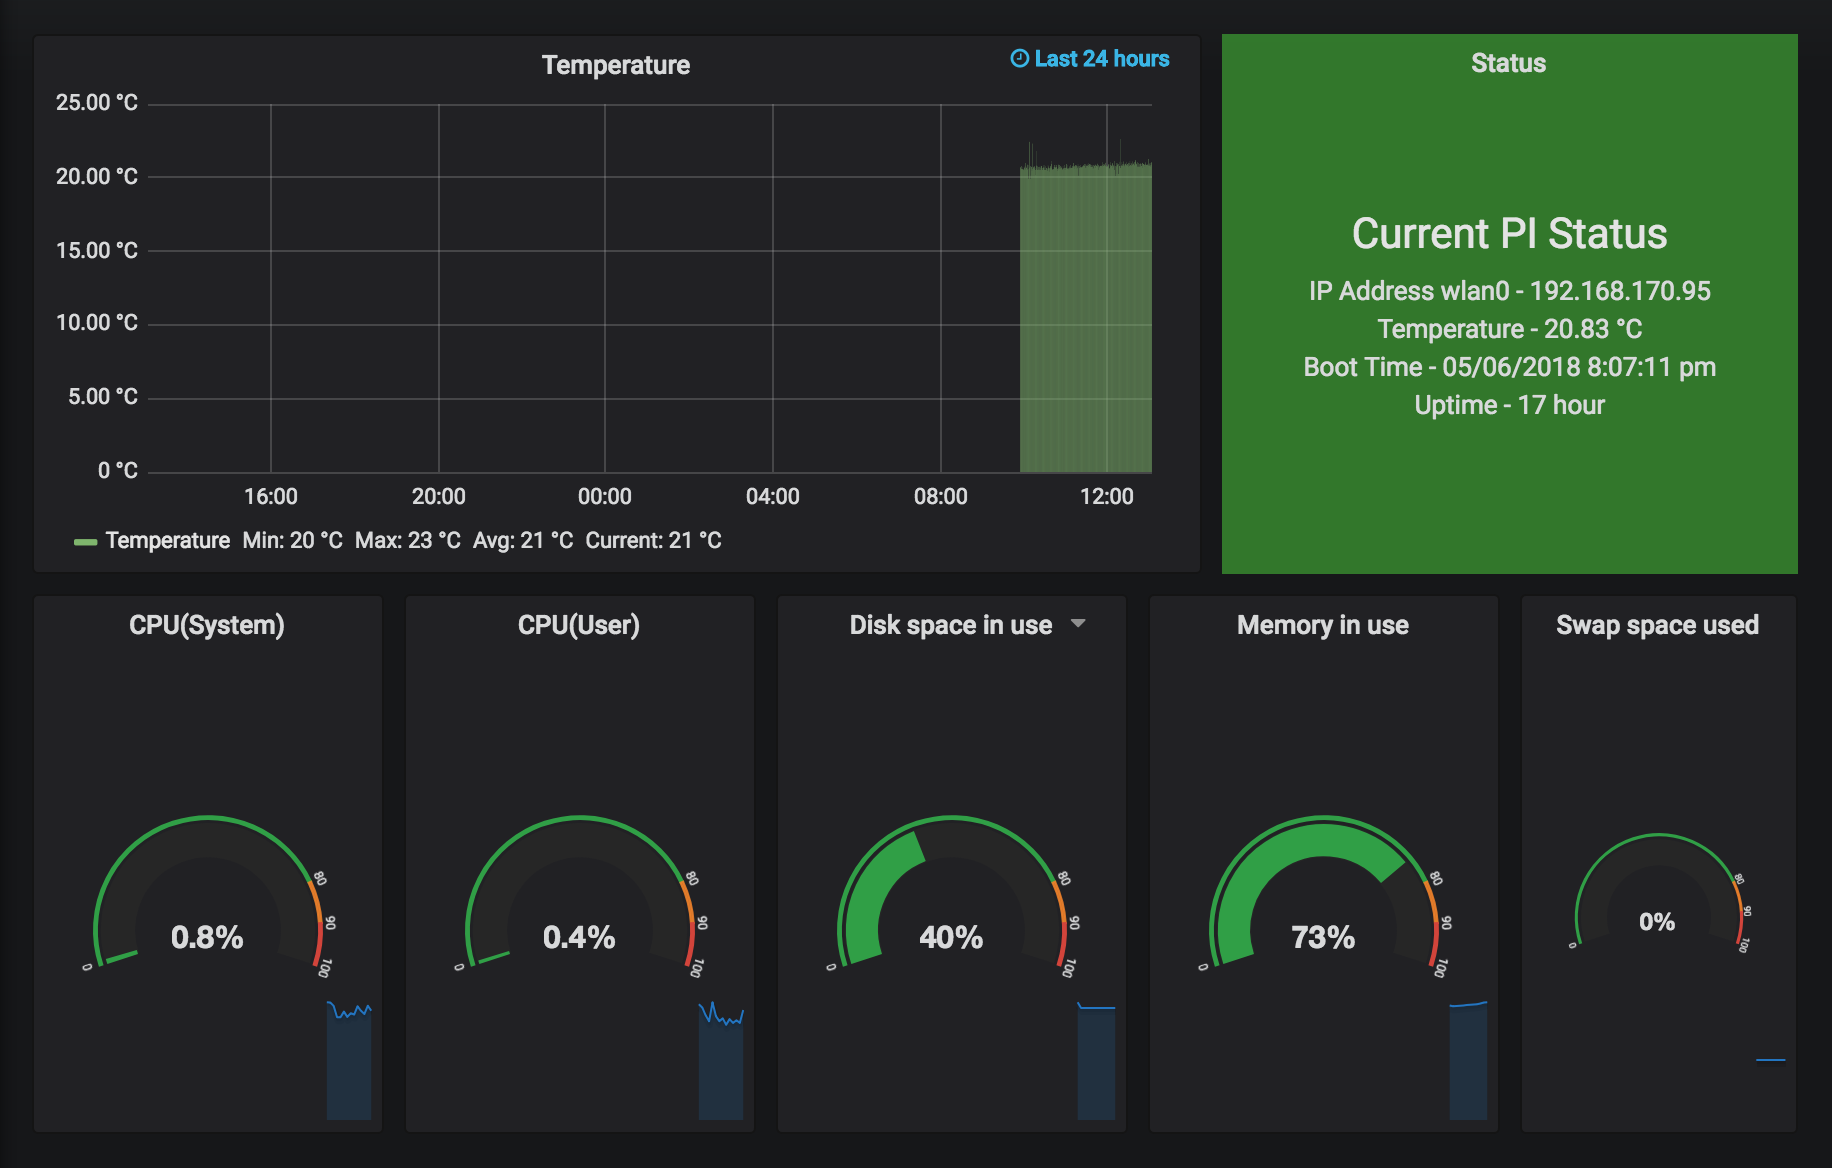
And lastly, the data is passed to a Zabbix Server and presented vi a Grafana Dashboard as below.

